 |
Boca Raton FL (SPX) Nov 05, 2009 The $2.6 billion (manufacturers' dollars) U.S. solar industry has experienced strong growth over the past five years. Demand soared due to improved photovoltaic technologies and lower prices; sharp increases in competing energy costs, and the expansion of government and financial incentives. This resulted in a 55.0% industry compound annual growth rate. The sharpest gains in industry sales were made to commercial and government building owners and electric utilities, while competitors increased sourcing from foreign plants. Currently, demand has leveled off due to the recession and credit crisis. This caused sharply lower PV prices as material costs dropped and competitive pressures intensified. It also adversely impacted solar industry manufacturer profit margins. Lower PV prices, however, is making solar energy more competitive with purchased electricity, especially in high energy cost states such as California and New Jersey. Lower prices will also stimulate future growth as the economy rebounds and government requirements cause consumers to turn to renewable energy sources.
Solar Industry Market Trends PV trends are segmented for crystalline silicon, thin-film, and concentrator silicon technologies; and solar thermal collectors for low-, medium-, and high-temperatures. Data is also provided for complete systems.
U.S. Shipments And International Trade Similar data is provided for export shipments. In addition, this section reviews the various solar technologies employed and recent technical innovations.
End-Use Markets And Distribution Solar thermal collector uses include pool, hot water, and space heating. Purchases are further analyzed by state. The report also investigates sales to installers, wholesalers, retailers, and directly to end-users.
U.S. Solar Energy Consumption And Factors Affecting Demand Electricity sales and costs were also tracked. An analysis of energy costs by household income and region and state also provide a guide to regional sales potential. In addition, Catalina reviewed government and financial incentives that have enhanced solar energy cost competitiveness.
Solar Industry Profitability And The Competitive Environment As part of this process, Catalina profiled 14 leading U.S. suppliers of photovoltaic products and three leading suppliers of photovoltaic manufacturing equipment. Company profiles cover product lines, and technology, manufacturing and distribution, acquisitions and capital investments, and sales and profit trends. Share This Article With Planet Earth
Related Links Get the full Catalina Report on the U.S. Solar Industry All About Solar Energy at SolarDaily.com
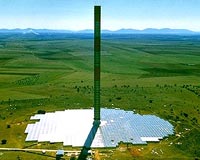
 EnviroMission Solar Tower Wins SCPPA Approval
Phoenix AZ (SPX) Nov 04, 2009 US power purchase negotiations to deliver the first of two, 200 MW Solar Tower power stations, have been given the green light from Southern California Public Power Authority (SCPPA). Solar Tower power station developments planned for Arizona have been approved by SCPPA as suitable renewable energy projects to facilitate the goals of its members' renewable portfolio standards (RPS). ... read more |
|
| The content herein, unless otherwise known to be public domain, are Copyright 1995-2009 - SpaceDaily. AFP and UPI Wire Stories are copyright Agence France-Presse and United Press International. ESA Portal Reports are copyright European Space Agency. All NASA sourced material is public domain. Additional copyrights may apply in whole or part to other bona fide parties. Advertising does not imply endorsement,agreement or approval of any opinions, statements or information provided by SpaceDaily on any Web page published or hosted by SpaceDaily. Privacy Statement |