A remarkably detailed animation of the movement of the densest and coldest water in the world around Antarctica has been produced using data generated on Australia's most powerful supercomputer, Raijin.
Chief Investigator Dr Andy Hogg from the ANU hub of ARC Centre of Excellence for Climate System Science worked with the National Computational Infrastructure's Vizlab team, using a high-resolution ocean model, to produce the animation. So much data was used, that it took seven hours to process just one second of the animation.
The visualization has revealed underwater ocean storms generated by eddies, waterfalls of cold dense water that plummet two kilometres off the Antarctic Continental Shelf into the abyss and underwater waves hundreds of metres high. "Scientists who have seen the visualization have been astonished at the level of detail," said Associate Prof Dr Andy Hogg.
"But this visualization is about more than communicating the wonder of science to the public. Being able to actually see how the bottom water moves in three dimensions rather than just looking at numerical, two dimensional outputs has already opened new areas for scientific research."
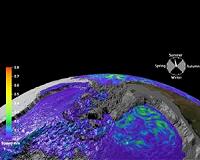
This latest animation peels back much of the surface layer of the ocean to explore how the cold dense water produced on the Antarctic continental shelf spreads out into every ocean basin in the world.
The movement of this dense water is vital. It is the most oxygenated water in the deep ocean and its extreme density and coldness drive many of the significant currents in the major ocean basins connected to the Southern Ocean.
The distinctly different densities of water that move around Antarctica also make it important in regards to climate change. Because the most dense water forms near the surface, close to Antarctica, before descending to the ocean floor, any warming that occurs near the surface can be drawn down into the deep ocean.
Importantly, this drives heat and carbon into the deep ocean, which would otherwise have returned to the atmosphere.
"The inhospitable climate of Antarctica and the lack of sustained observations of the ocean in this region over a significant period of time adds to the importance of using ocean models to create visualizations like these," Dr Hogg said.
"It helps us understand what is happening in locations that are difficult to observe and may explain why Antarctic bottom water is disappearing, becoming less saline and warmer. It may also give us important insights into a future under climate change."
– SPACE STORY –
eo
slug1
255
23-DEC-49
Liquid acoustics half way to the Earth's core
Liquid acoustics half way to the Earth's core
interior-earth-sound-velocity-and-density-profiles-lg.jpg
interior-earth-sound-velocity-and-density-profiles-bg.jpg
interior-earth-sound-velocity-and-density-profiles-sm.jpg
The interior of the Earth and sound velocity and density profiles.
by Staff Writers
Tokyo, Japan (SPX) Dec 02, 2015
The most direct information about the interior of the earth comes from measuring how seismic acoustic waves – such as those created by earthquakes – travel through the earth. Those measurements show that 95% of the earth's core is liquid. But, scientists also want to know the composition of the liquid, and that is harder.
Now, in research published in Nature Communications, scientists from the Materials Dynamics Laboratory at the RIKEN SPring-8 Center, along with collaborators from the Tokyo Institute of Technology's Earth-Life Science Institute and other institutes, have succeeded in measuring the speed of sound in mixtures of liquid iron and carbon in extreme conditions, allowing limits to be set on the core composition.
According to Alfred Baron, head of the Materials Dynamics Laboratory, "Understanding the composition of the liquid within the earth's core is an important question, as it can give us clues about how the earth was formed."
It is known that the liquid in the core is mostly molten iron, but it has a density about 10% too small to be only iron, and geoscientists are trying to determine what elements are mixed with the iron to reduce its density.
Worldwide, researchers are now creating a 'catalogue' that matches sound velocities with material composition and temperature. However, the temperatures of materials inside the earth range up to several thousand degrees (greater than 5,000 K) and the pressures reach several million atmospheres, so measurements are difficult.
Thus the 'catalogue' has grown very slowly, with each point requiring man-years of work. Also, even though 95% of the earth's core is liquid, almost all the measurements so far have been of solids because they are easier to handle.
With the current work, the researchers succeeded in extending the catalogue to include the first liquid measurements taken at very high pressure. Using a combination of diamond anvil cell technology – where a sample is squeezed between two diamonds – laser heating, and a large inelastic scattering spectrometer at SPring-8, weighing more than 20 tons, they were able to measure the sound velocity of liquid iron-carbon mixtures at very high temperatures and pressures.
While the values they achieved were only about half that of the outermost part of the liquid core – where the pressure is about 1.3 million atmospheres, and the temperature about 4,000 K – they were able to extrapolate to core conditions from the measurements.
According to first author of the study, Yoichi Nakajima, "The extrapolation gives us important insights, suggesting that at most only about 1.2% of the core, by weight, is carbon. Thus while there may be, and, in fact, probably is, some carbon in the core, there must also be some other light elements, such as silicon, oxygen, sulfur or hydrogen."
Says Baron, "While already leading the world in our ability to measure velocities like this under extreme conditions, we willcontinue to work with different materials and even more extreme conditions at a new RIKEN facility, the Quantum NanoDynamics Beamline, BL43LXU, at SPring-8".
